Building Vault with three Workbenches
We built a Doppler-style secrets manager from an empty repo with three Workbenches, then hosted it for our own team, fixing the Workbenches as we went. Here's what it cost, how long it took, and how good the result is.
- $43.70
- model cost, every run included
- 61
- Workbench runs, 33 of them building features
- 16.9 h
- total run time, start to finish
- 33 of 37
- pull requests opened by Workbenches
- 82
- browser tests, the full suite in under 5 minutes
The setup
Vault is a secrets manager for small teams. It has workspaces with roles, projects with development, staging and production environments, versioned secrets with rollback, scoped service tokens, an audit log, and a CLI whose vault run -- <cmd> injects secrets as environment variables.
Three Workbenches did the building, each on GPT 6.1 Sol through OpenCode, running in cloud sandboxes:
| Workbench | Owns | Runs | Cost | Run time |
|---|---|---|---|---|
| hono-postgres-api | The API, database, auth and shared contracts | 29 | $8.99 | 3h 08m |
| svelte-frontend | The SvelteKit dashboard | 16 | $9.06 | 2h 37m |
| full-stack-e2e | Playwright tests against the real stack. It reports bugs and never changes app code. | 16 | $25.65 | 11h 11m |
Claude Code orchestrated the whole thing through the Workbenches MCP server. It wrote each task, started the run, answered the run's questions, reviewed the pull request, and handed the result to the next Workbench. Each feature went the same way: backend, then UI, then browser tests, then a fix run if the tests found bugs. Runs went one at a time, and each pull request stacked on the last.
A person stayed in the loop for decisions: what to build next, whether to change a Workbench, and clicking through the app after each merge.
What it looks like
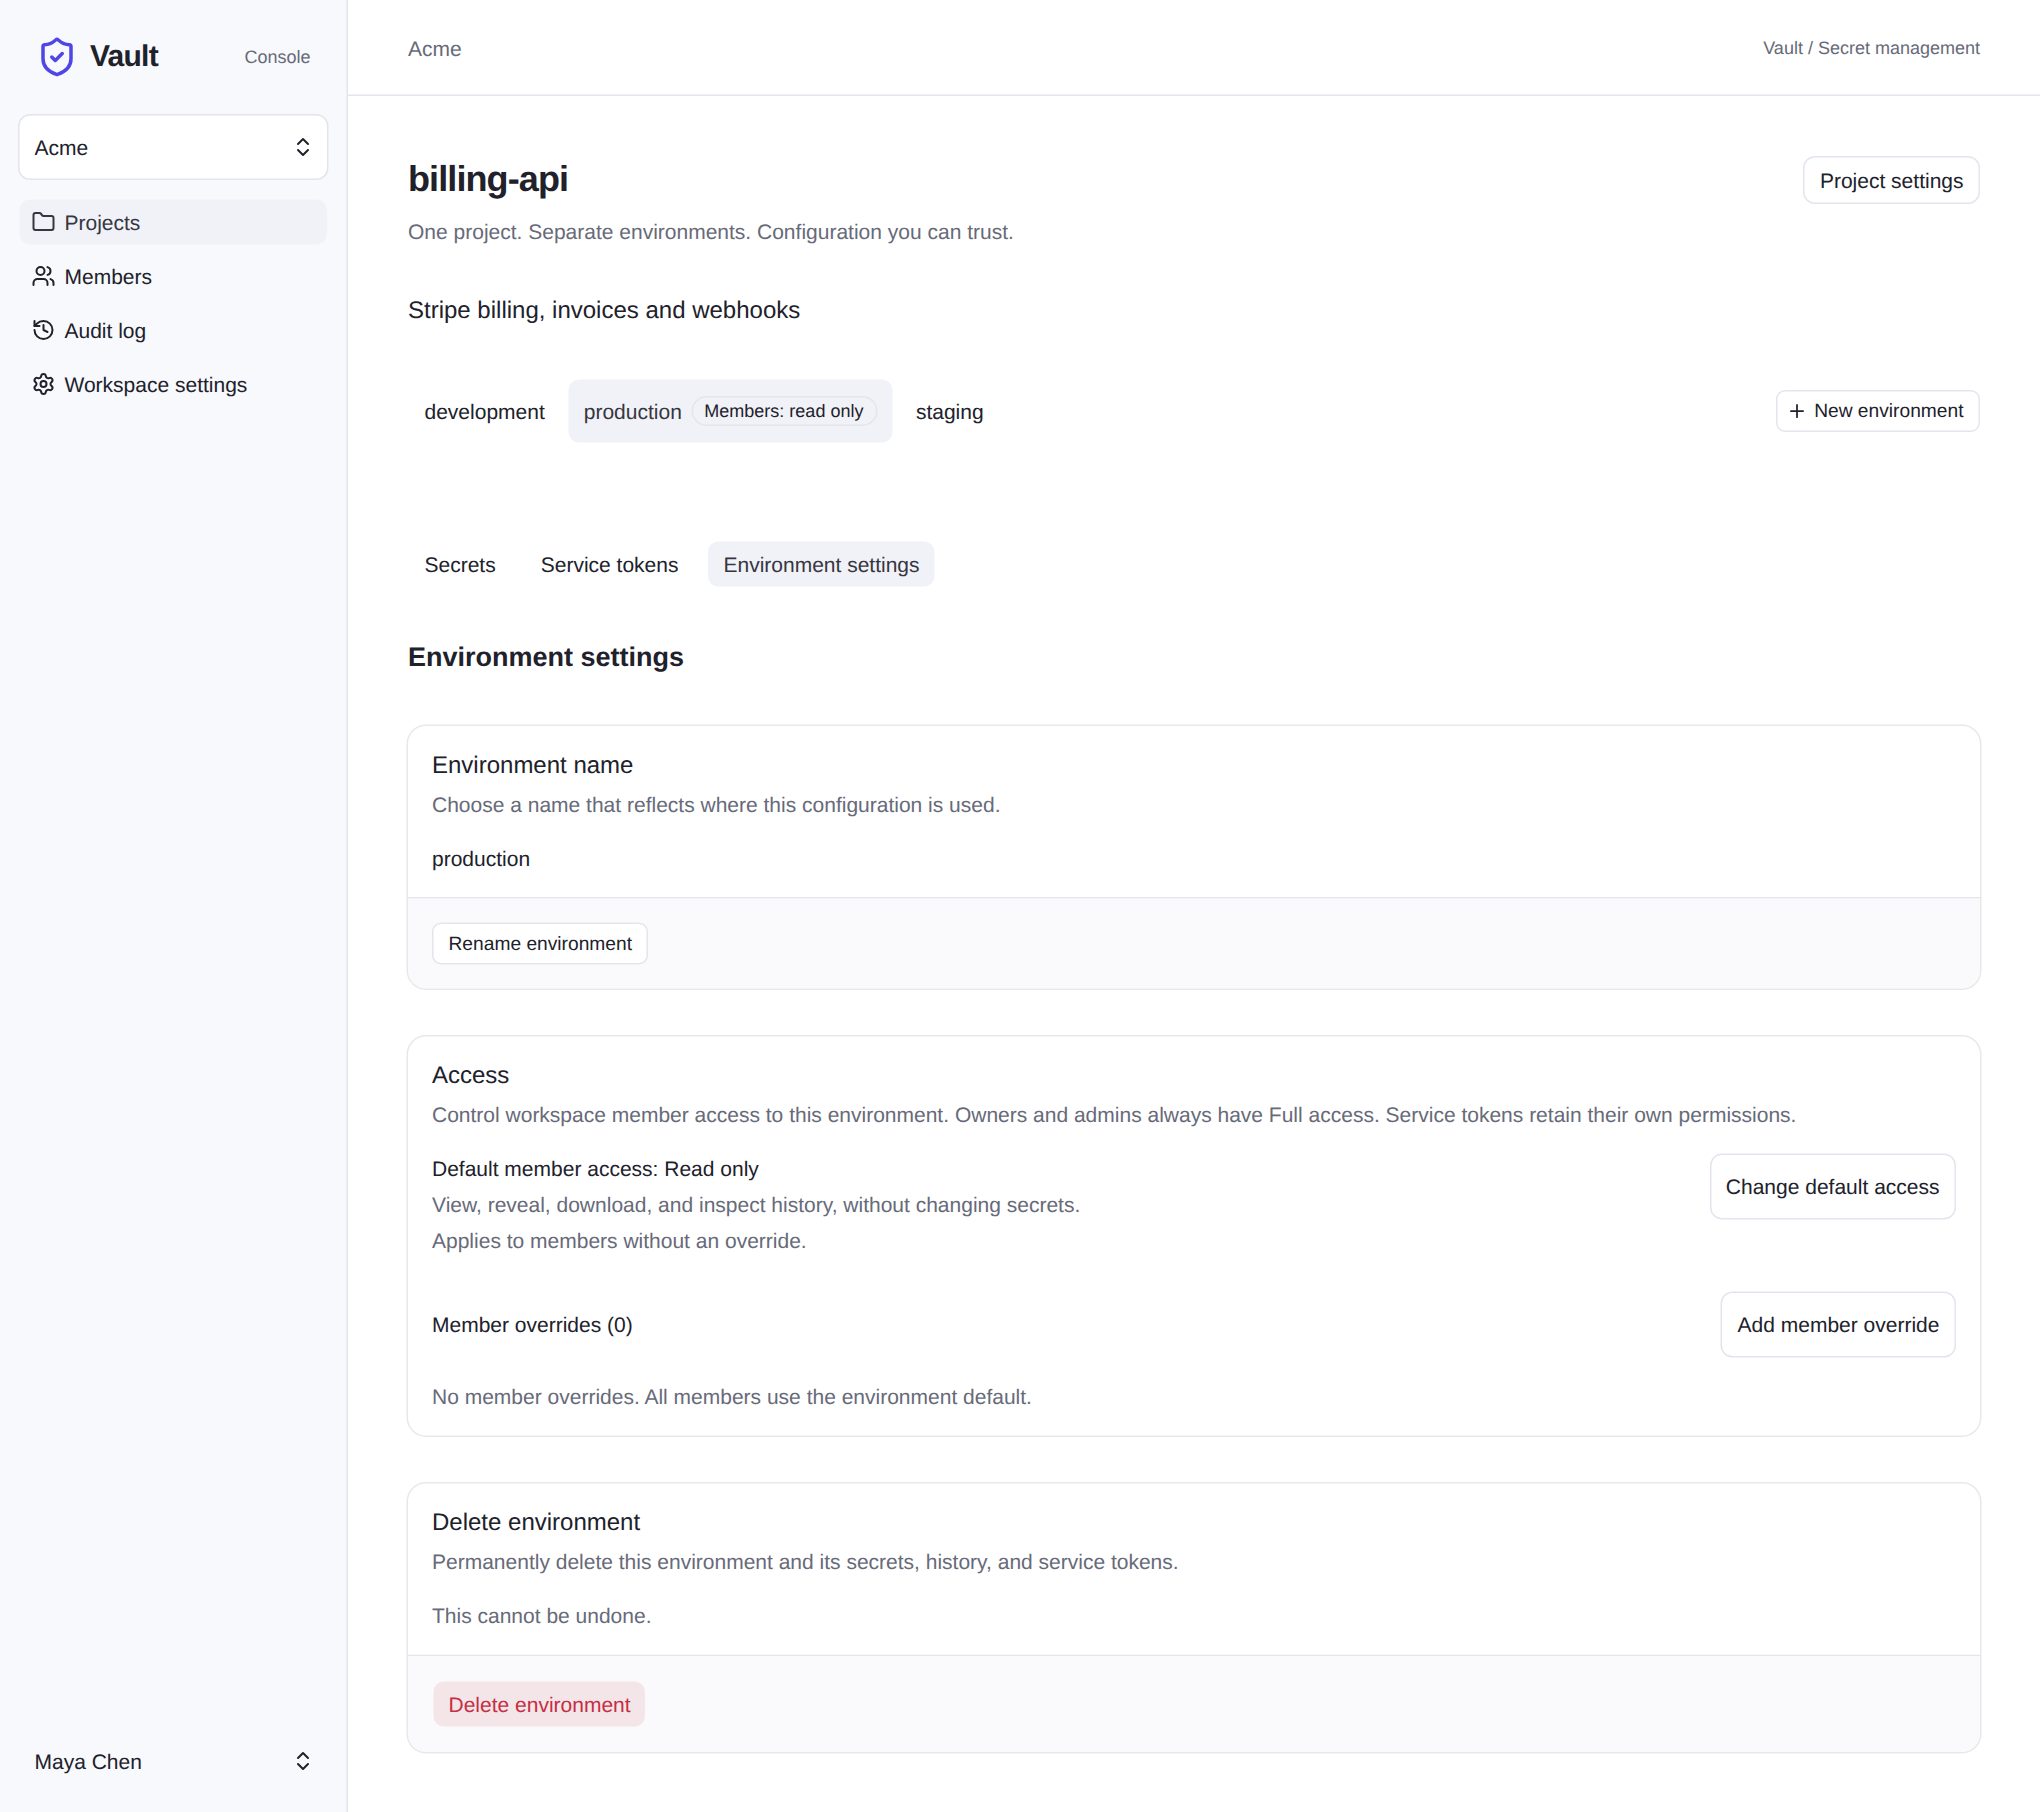
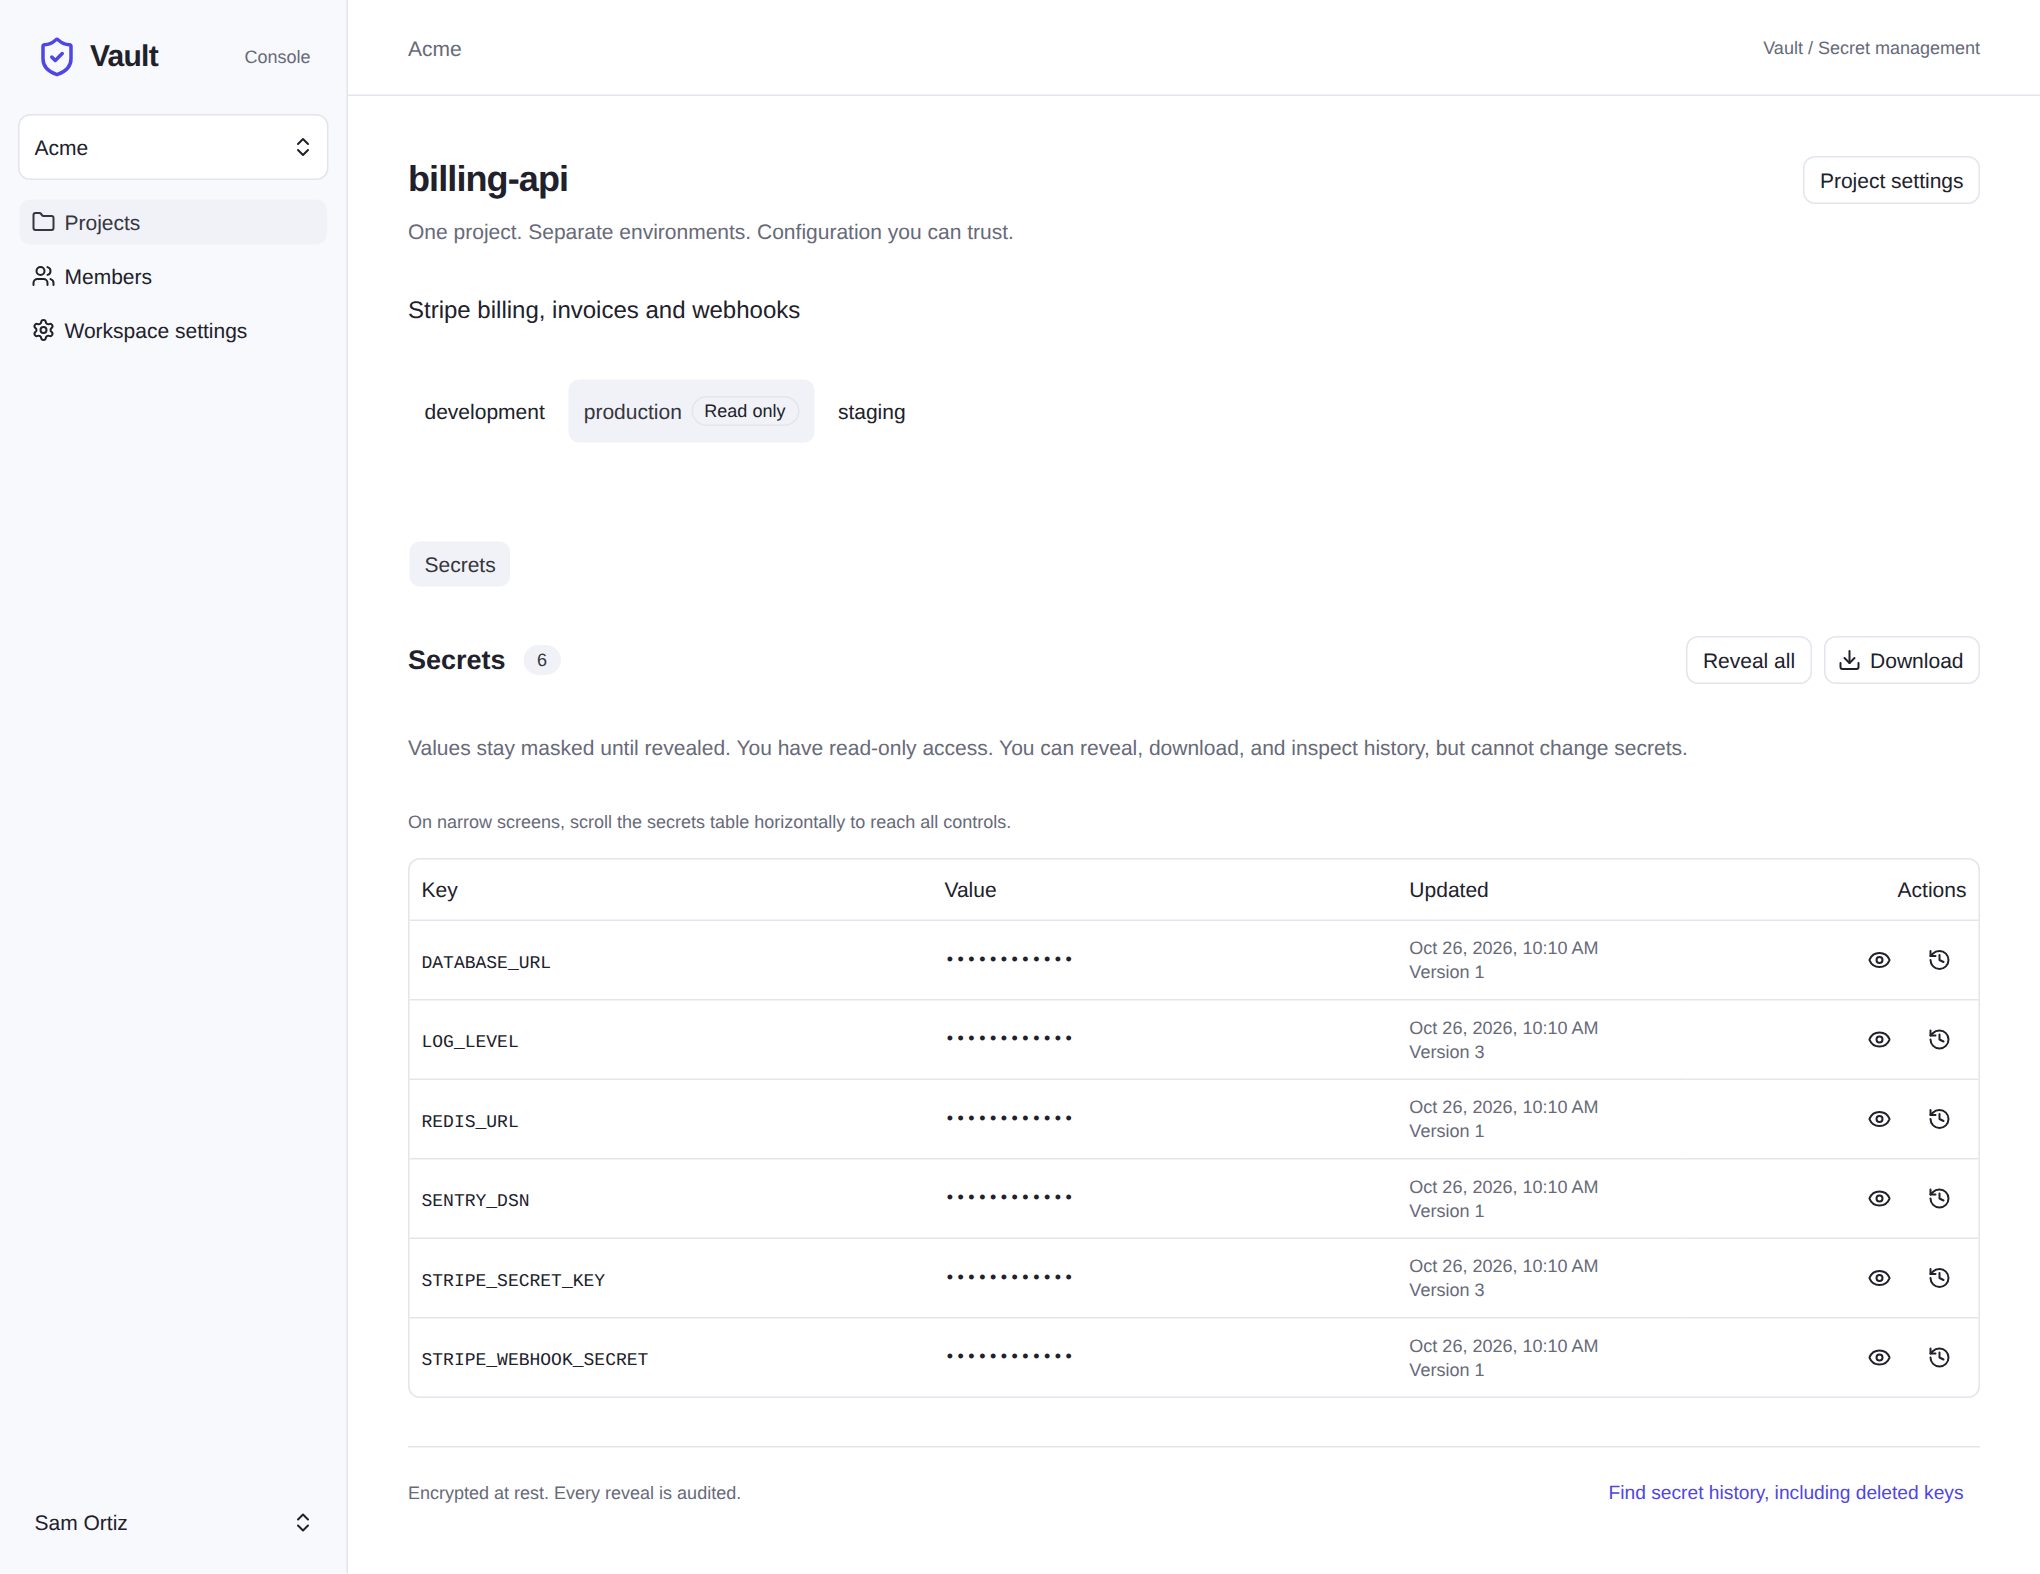
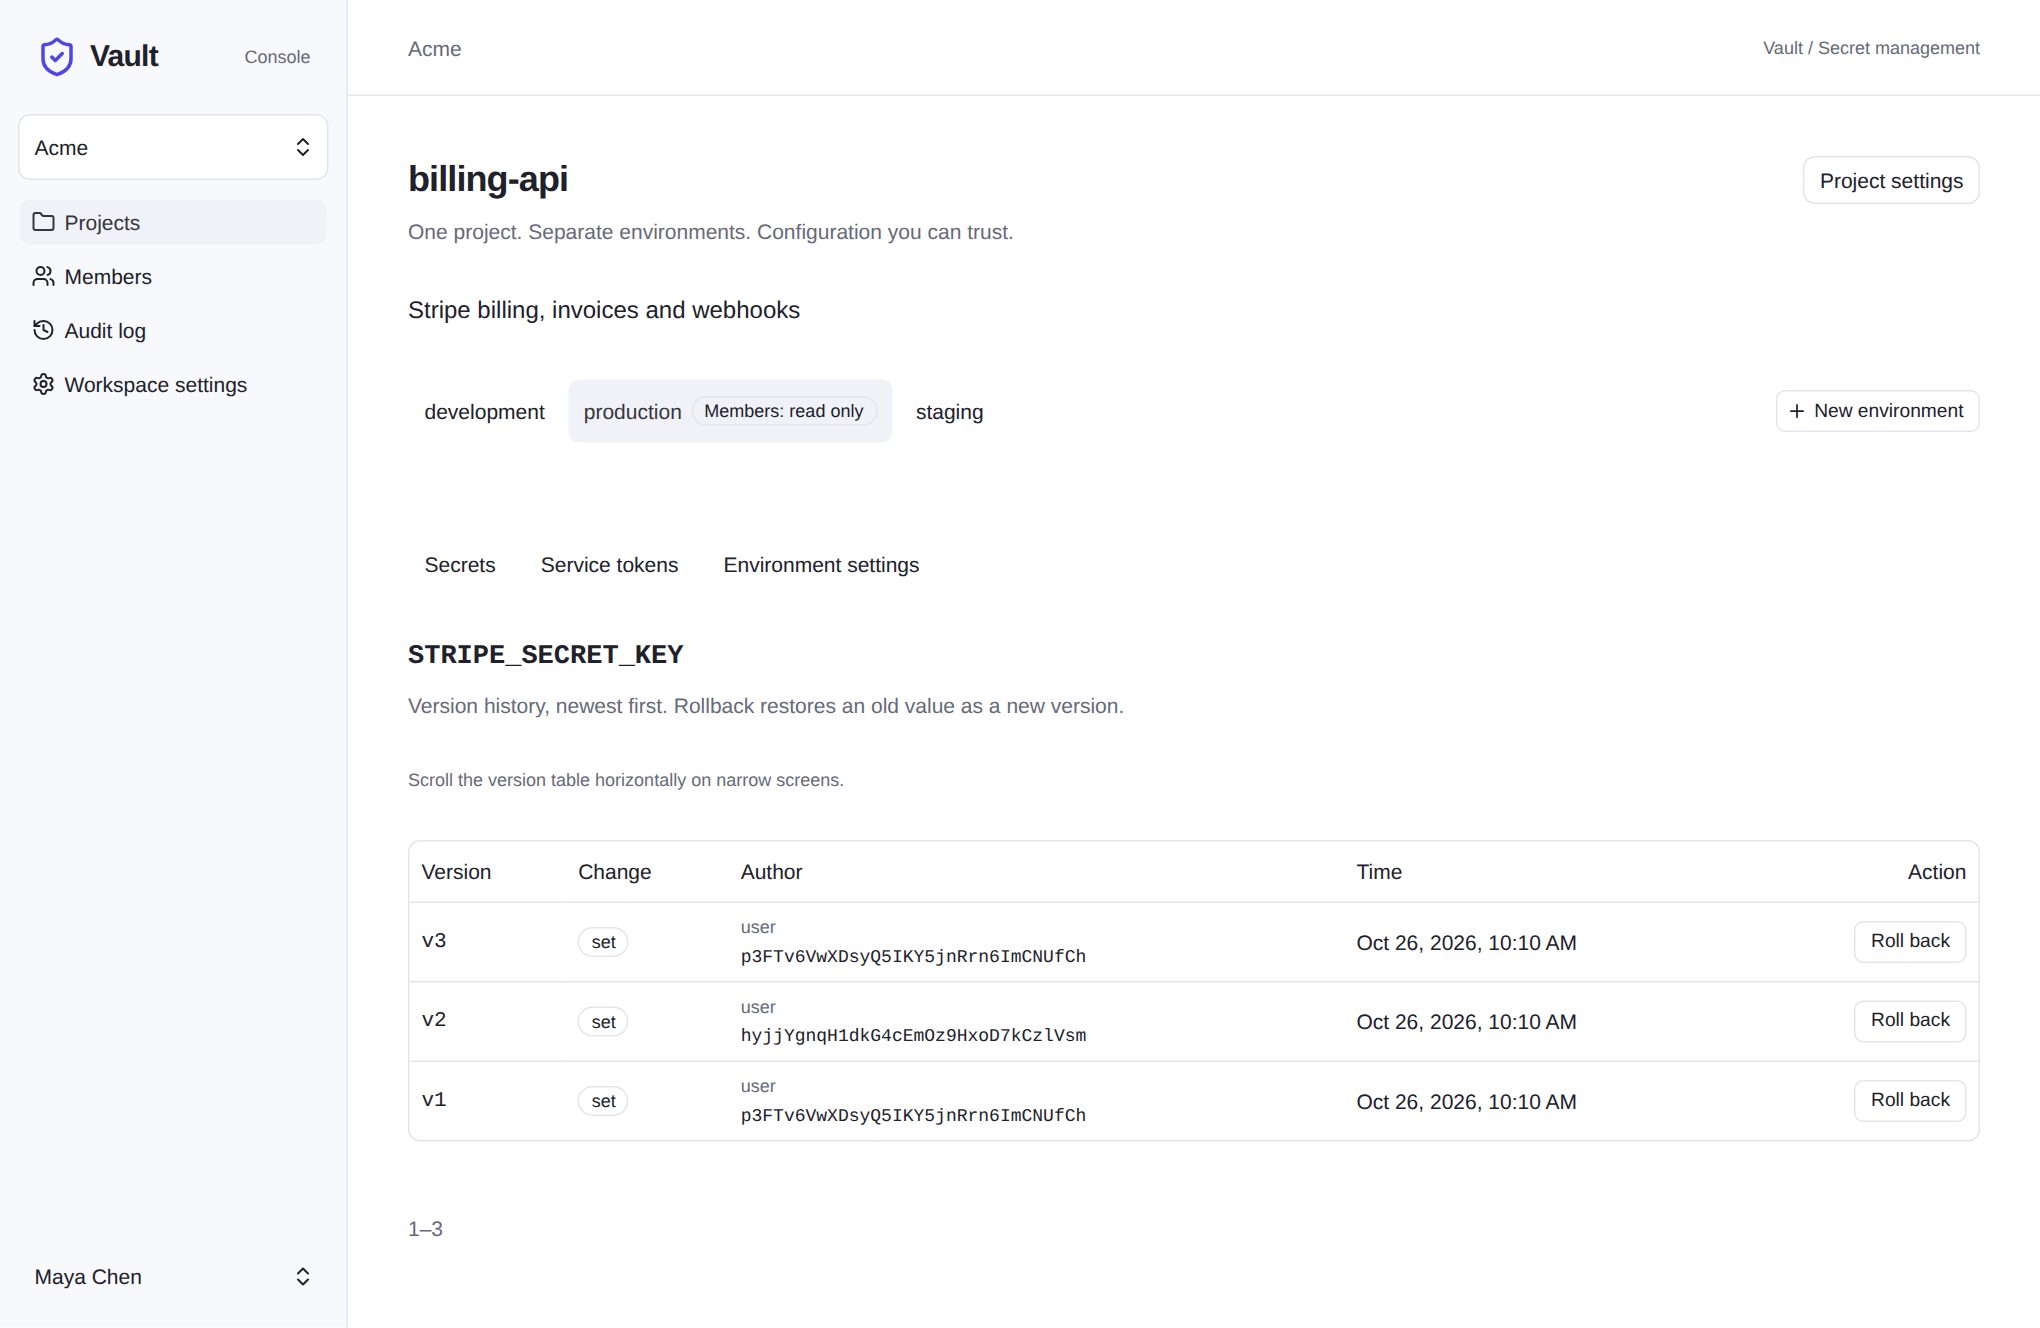
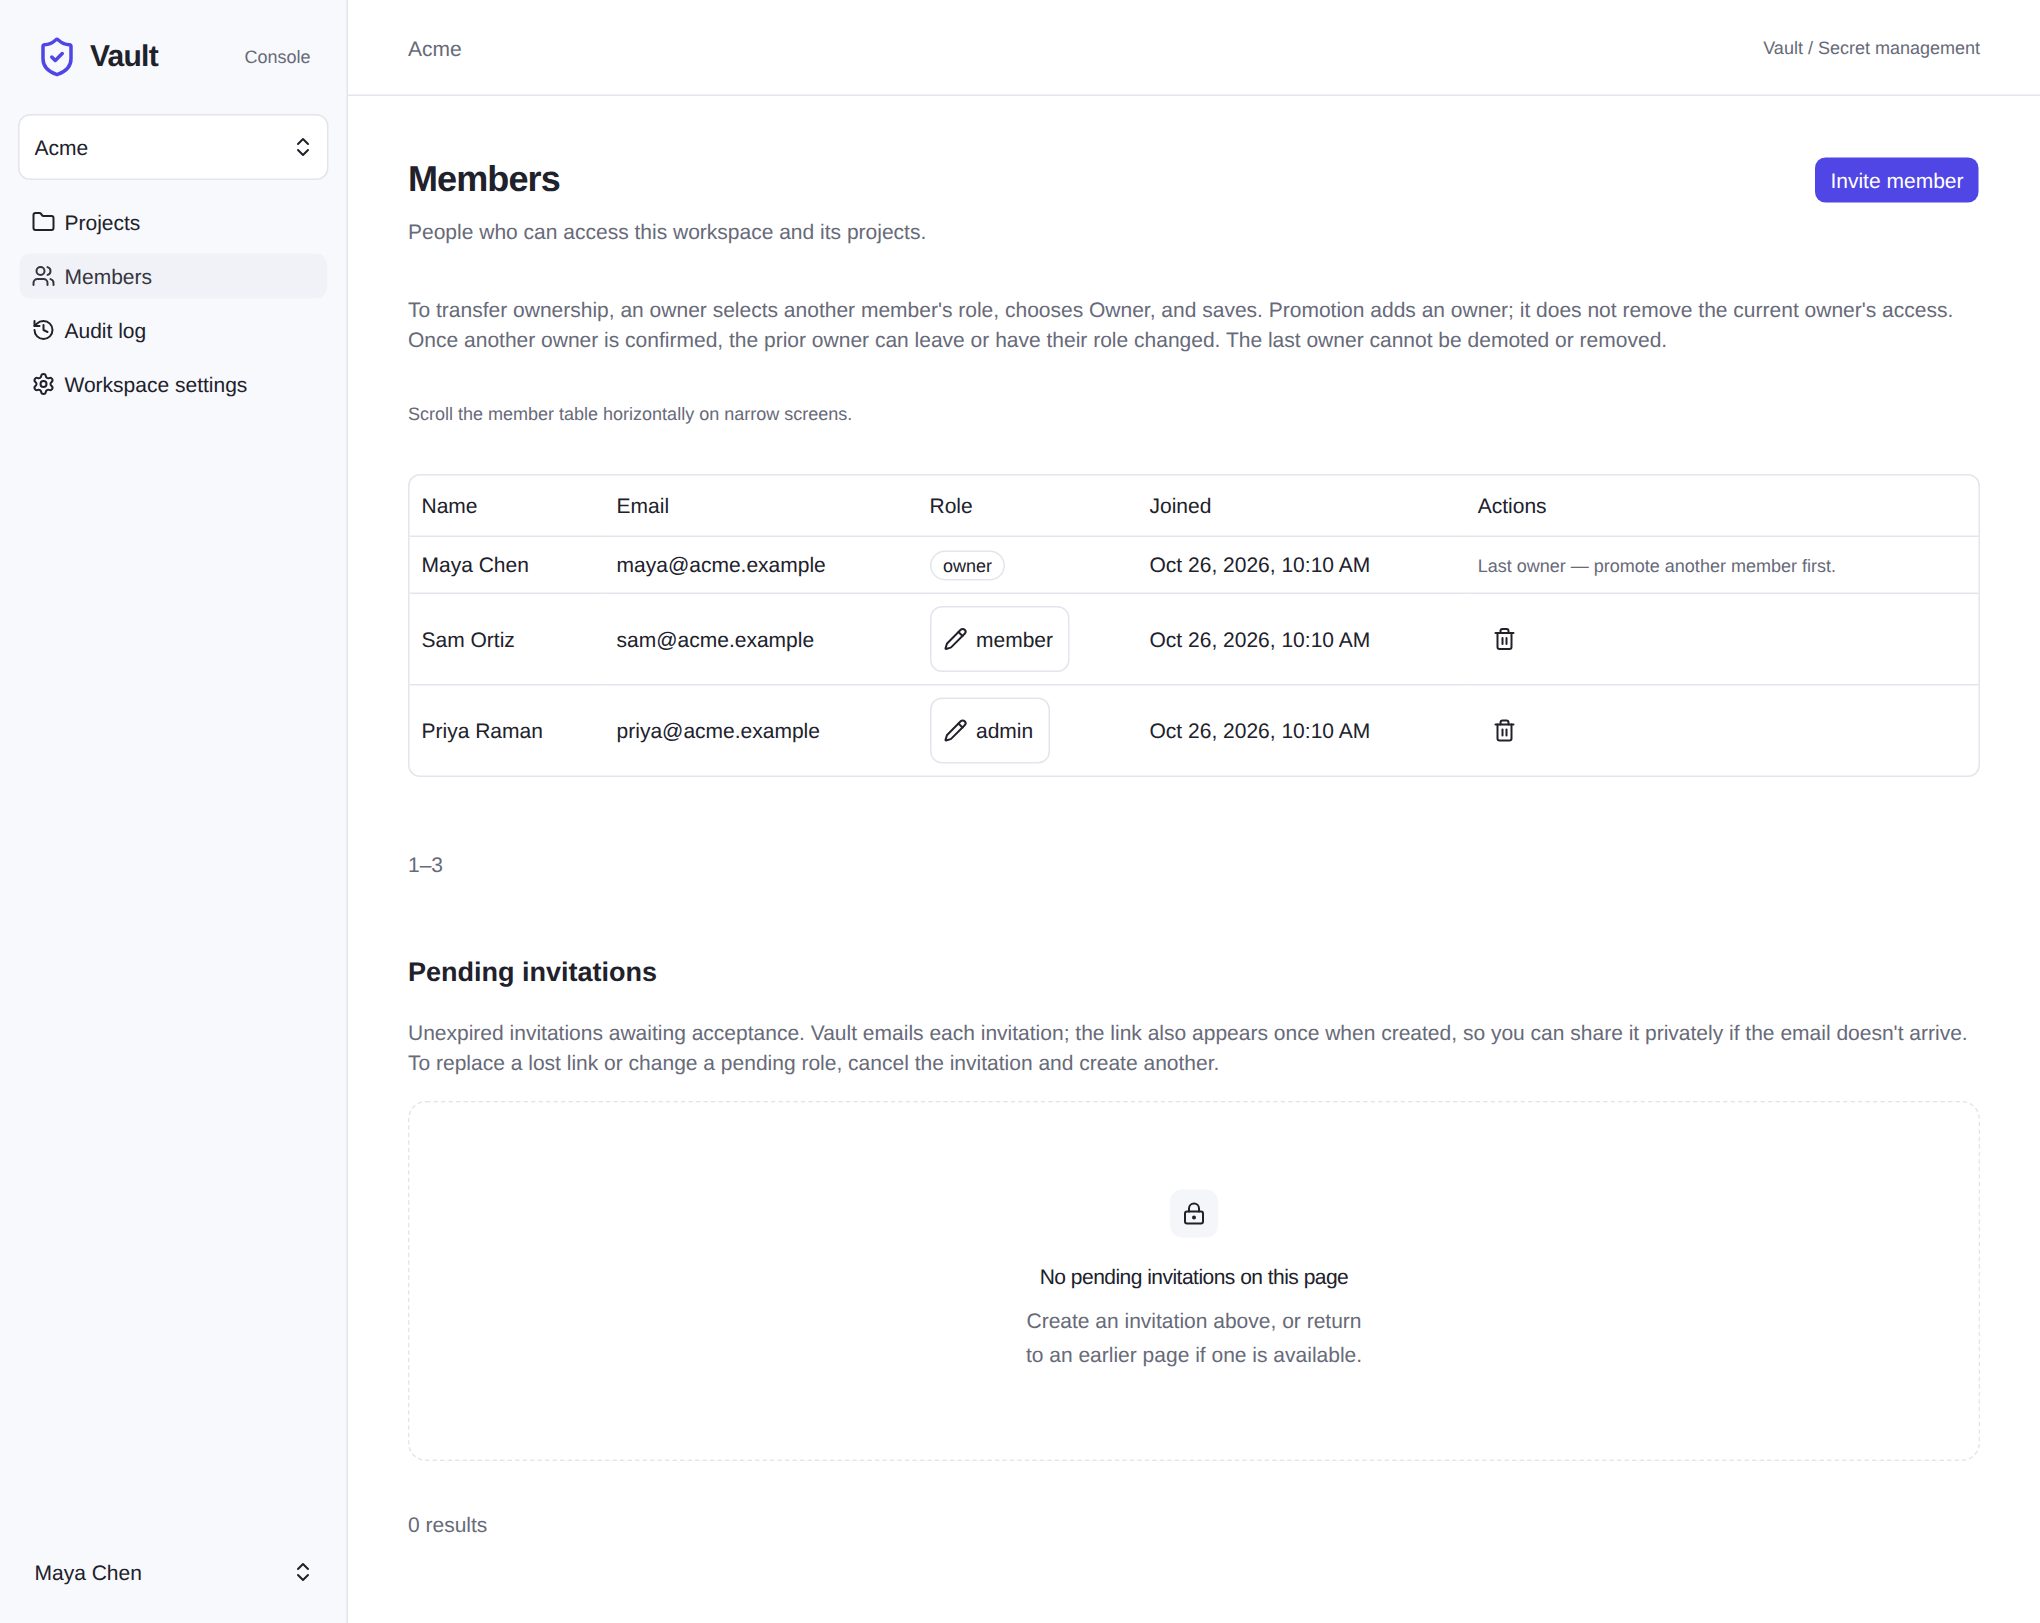
These screenshots come from a throwaway copy of Vault filled with example data: a team called Acme, three projects, and three people. Maya is the owner, Priya an admin, and Sam a member.
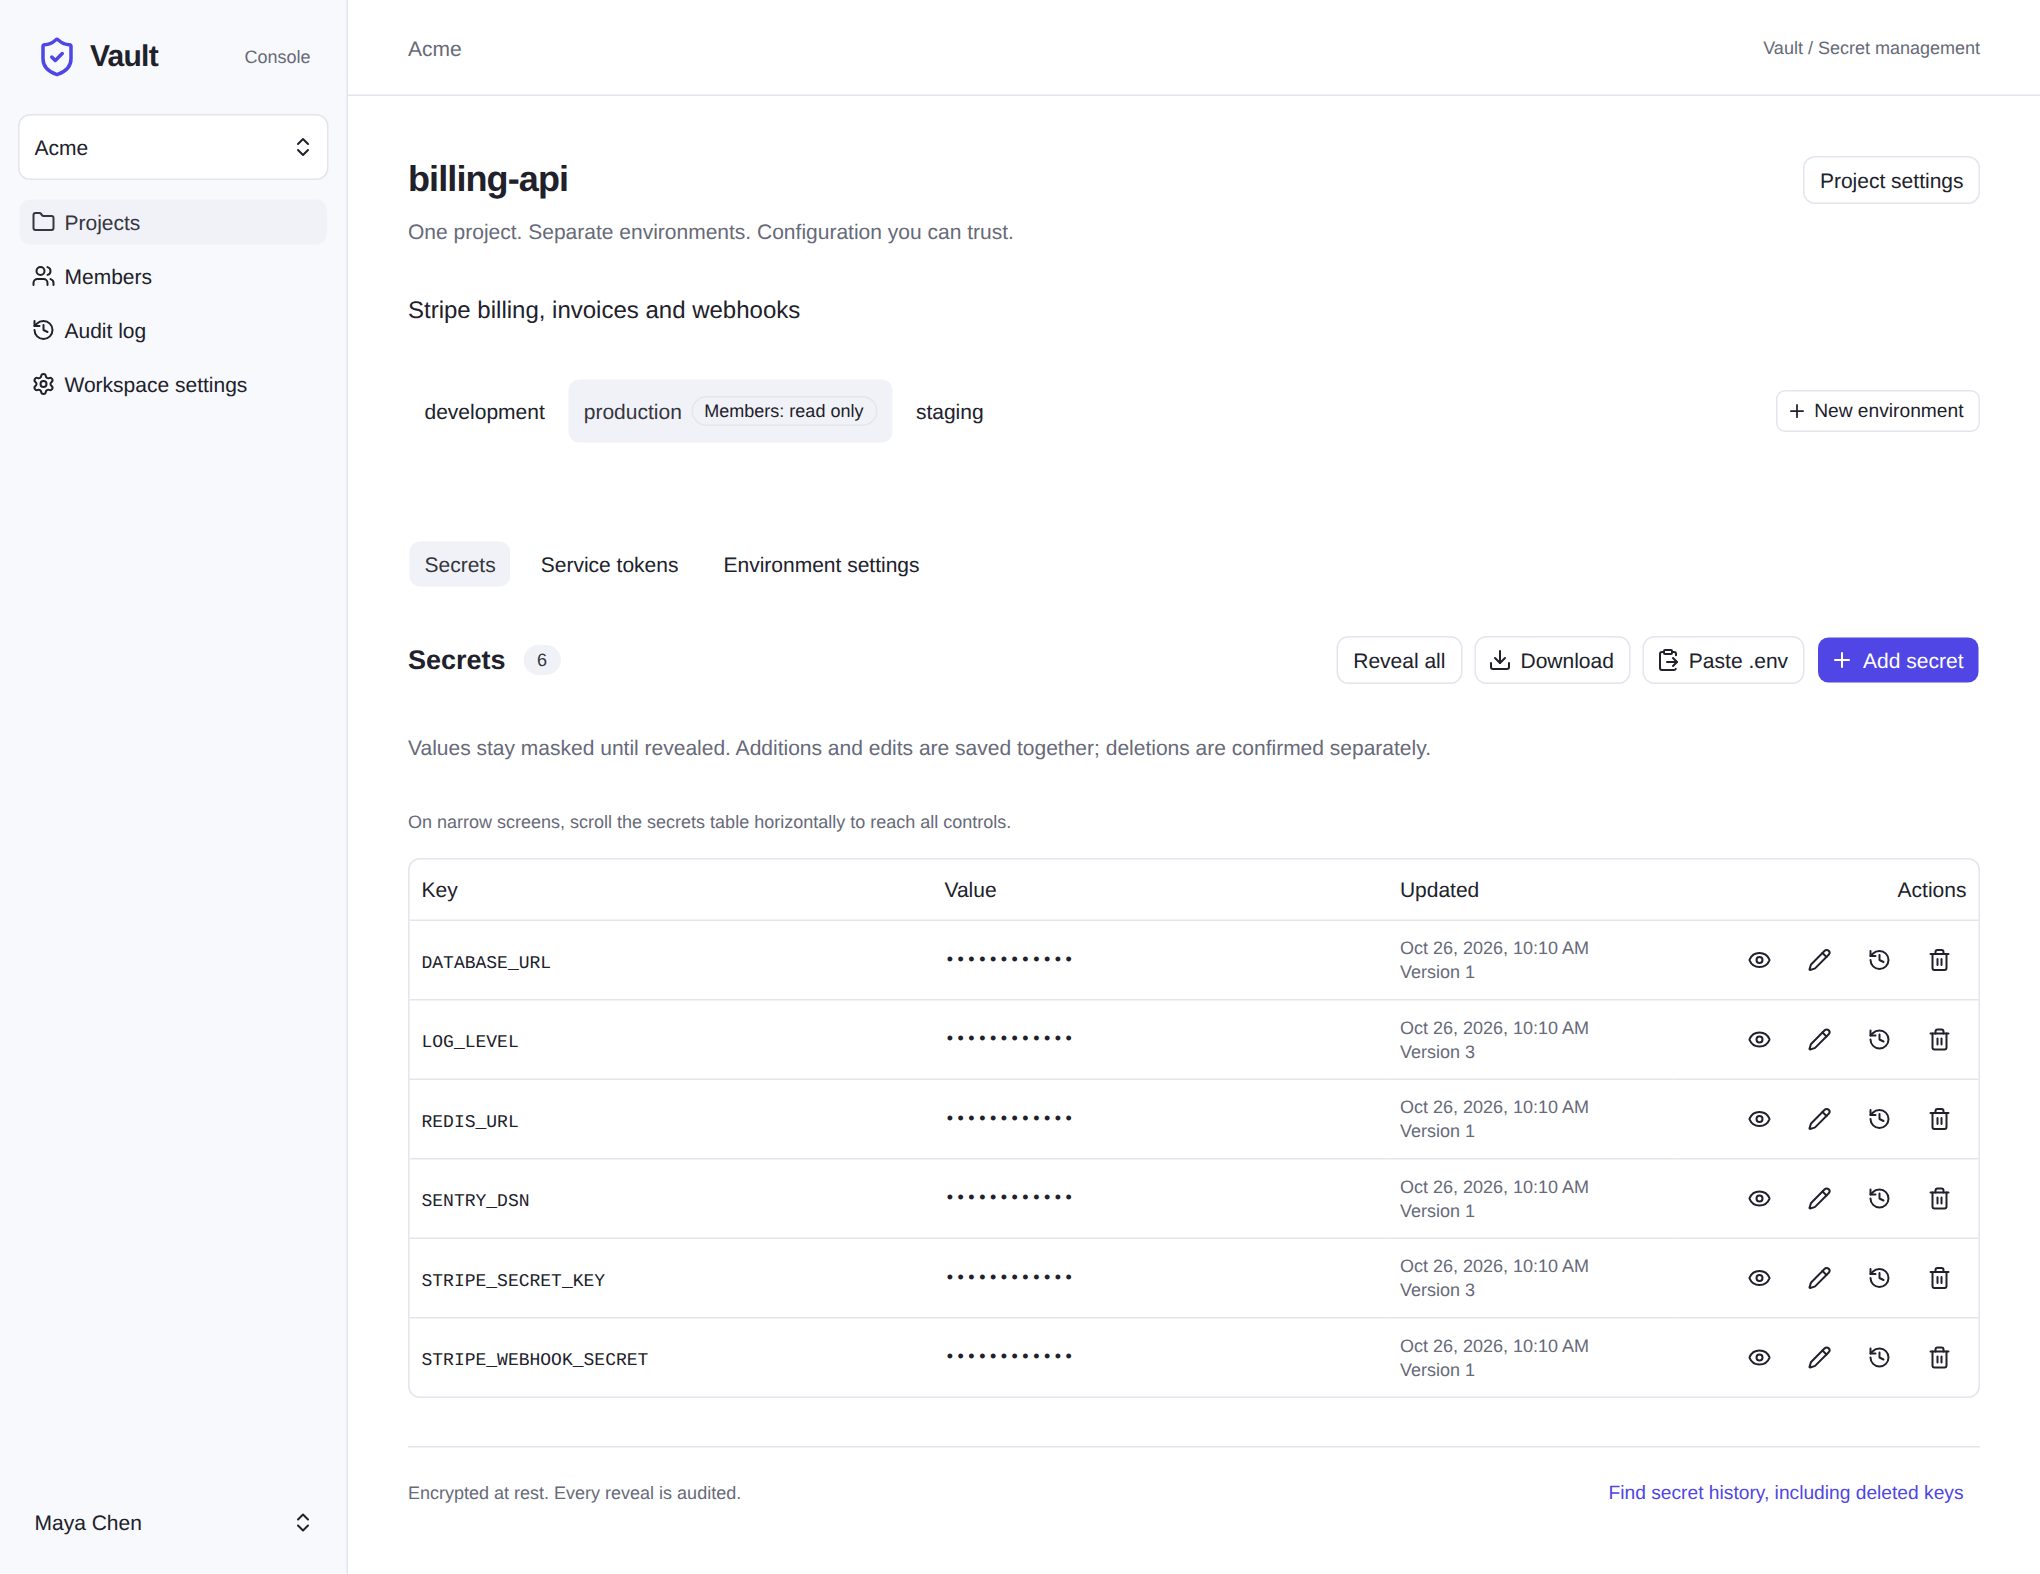
billing-api. Values stay masked until revealed, and every reveal is audited. The badge on the tab shows members get read-only access here.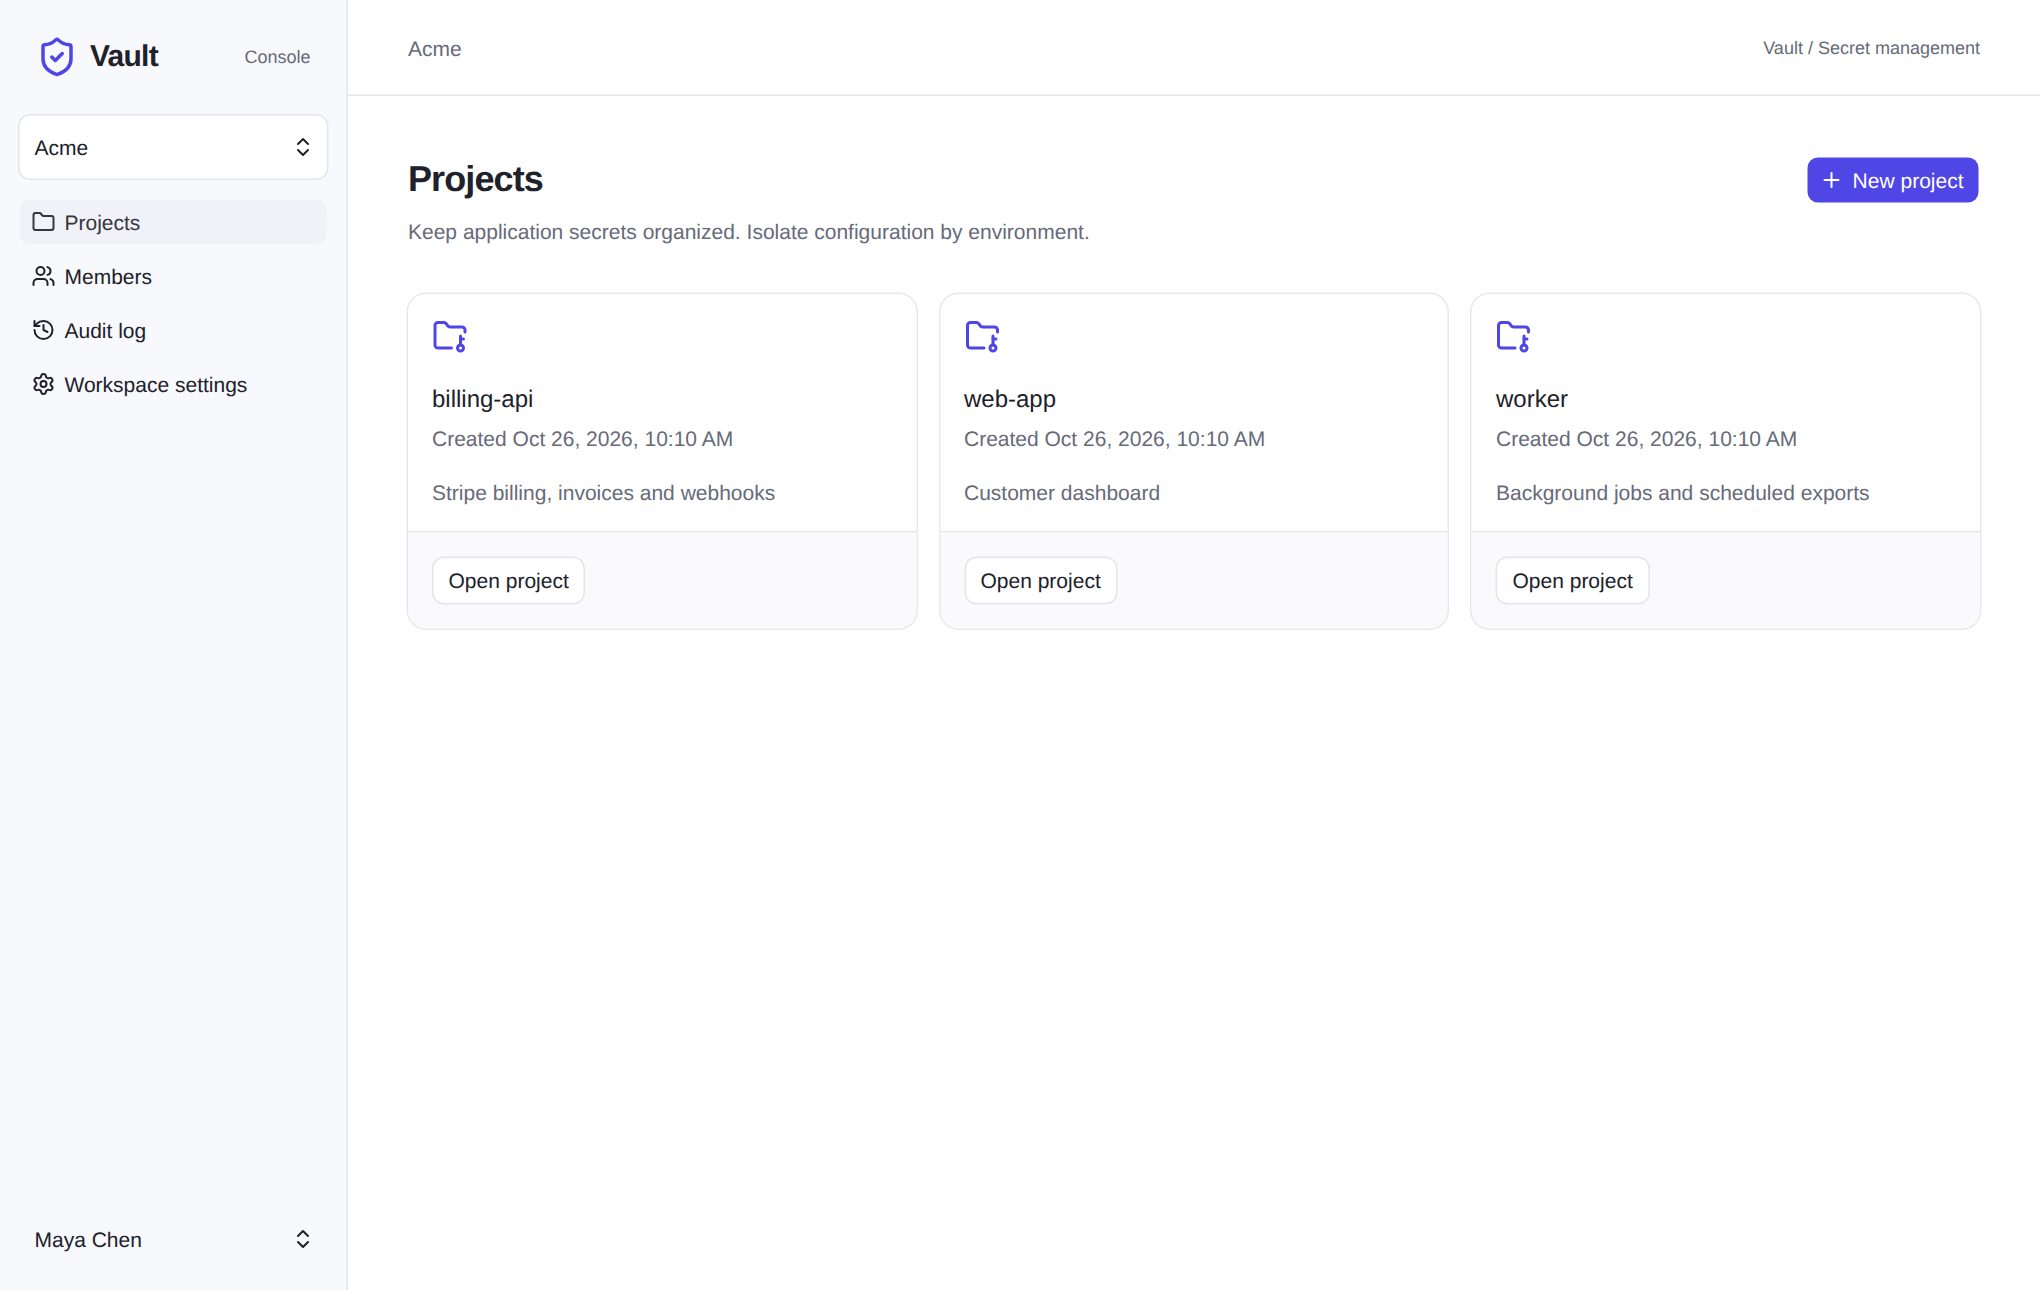
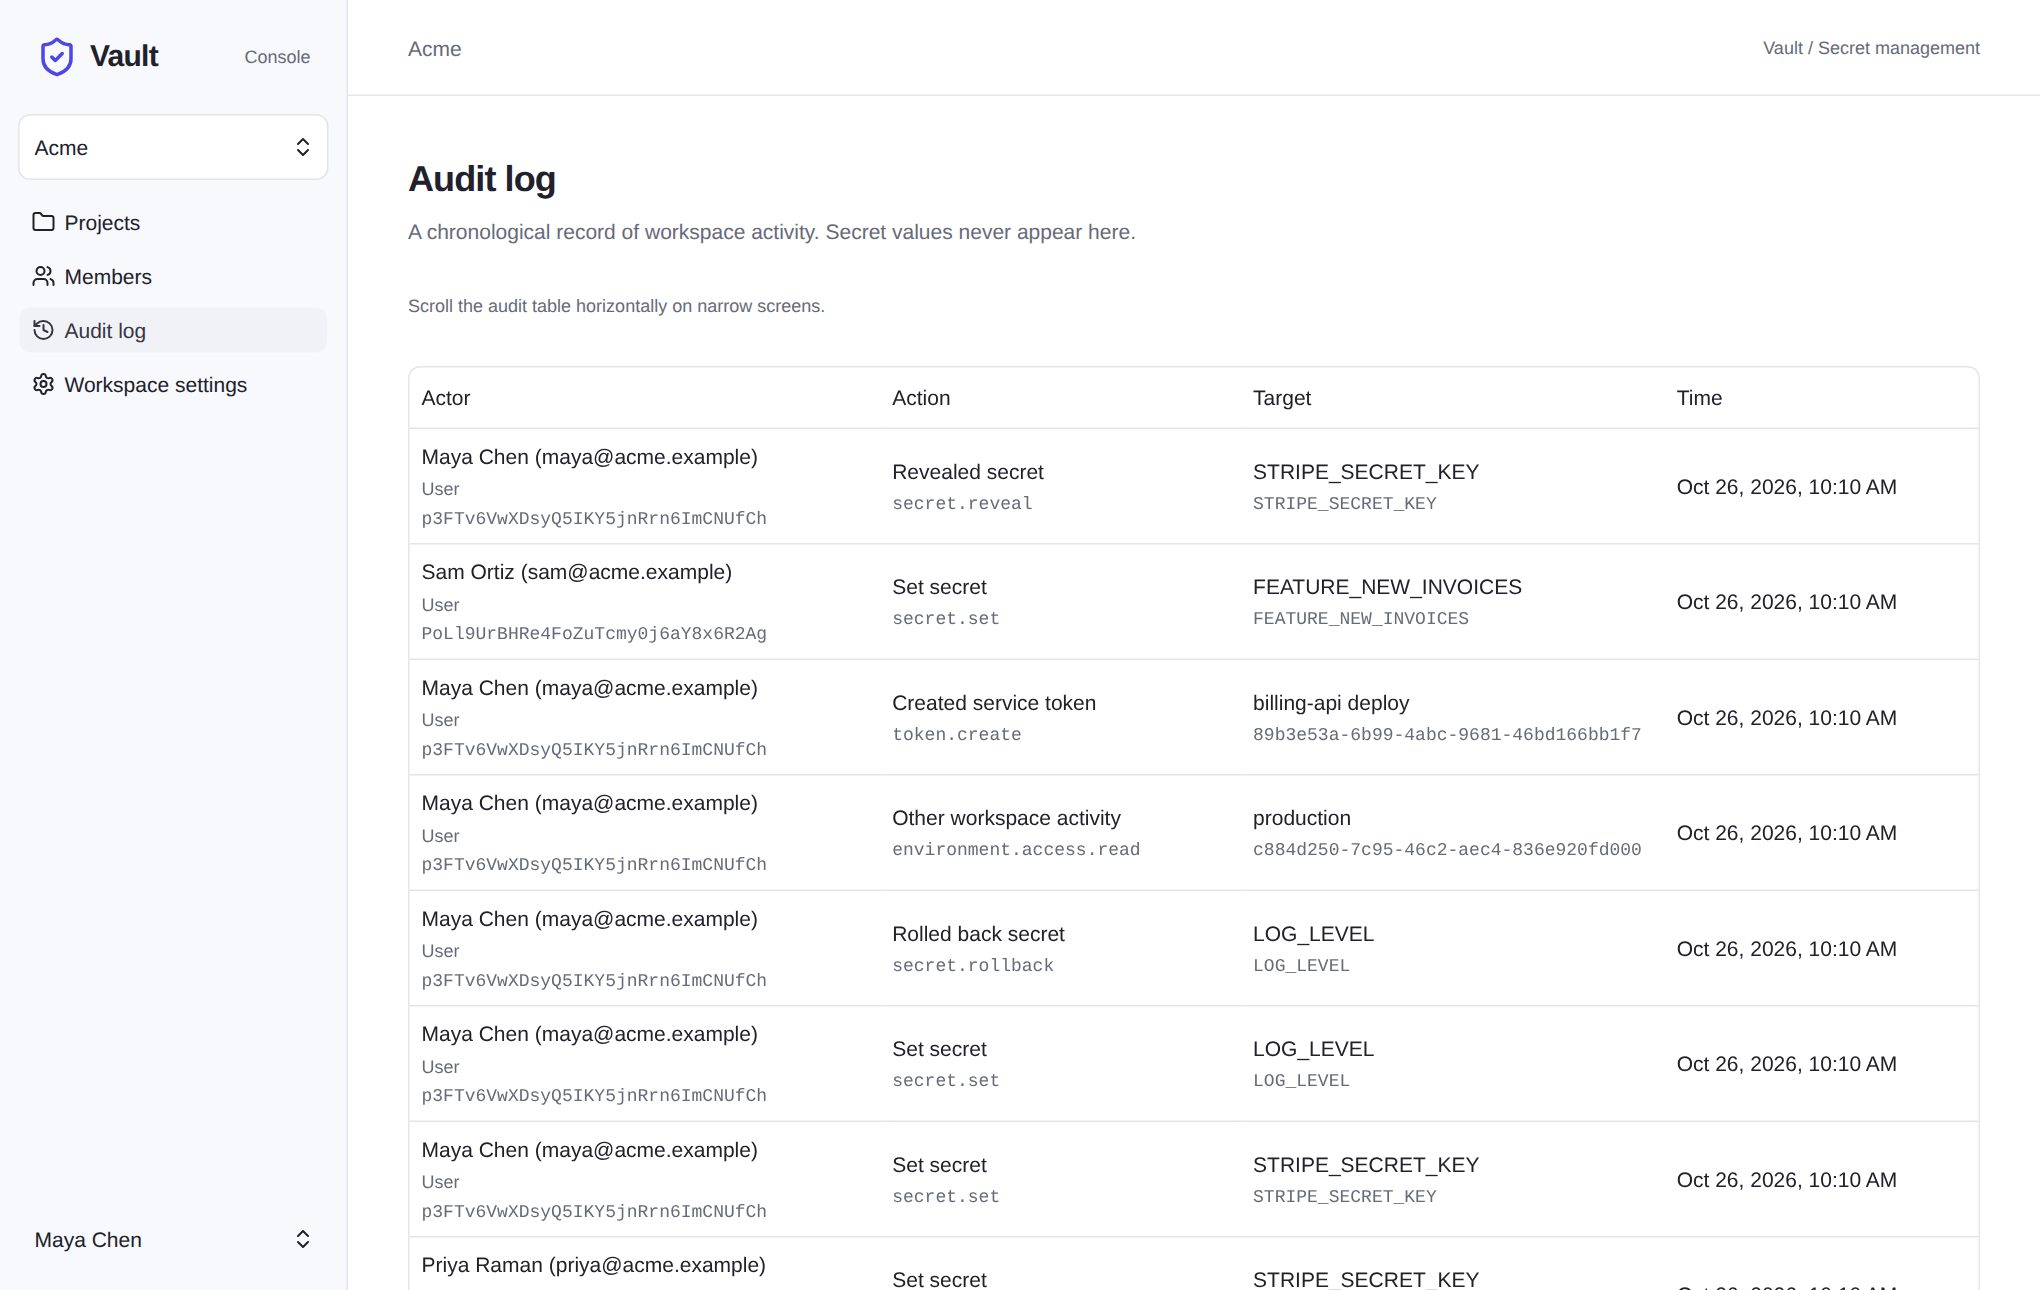
And the part developers use every day. Sam links a directory to an environment once, then runs his app through vault run:
$ vault login --api-url https://vault.acme.exampleLogged in. Credentials stored with owner-only permissions.$ vault setup --workspace ... --project ... --environment ...Bound this directory to the selected project and environment.$ vault run -- npm run dev# secrets arrive as environment variables, never written to diskSTRIPE_SECRET_KEY=sk_test_demo_51HdevLOG_LEVEL=debug# in a directory bound to production, where members are read-only$ echo error | vault secrets set LOG_LEVEL --stdinFORBIDDEN: Permission deniedReal output from the demo. The vault run line stands in for the command we ran, which printed two of the injected variables.
What it cost, feature by feature
Each row runs from the first backend run to the last passing test. Costs are model usage only.
| Feature | PRs | Runs | Cost | Run time |
|---|---|---|---|---|
| MVP: API, CLI, dashboard, sign-up and members, first browser suite, 3 bug fixes | #1 to #7 | 8 | $20.26 | 7h 47m |
| Account and workspace management | #8 to #12 | 5 | $5.59 | 2h 41m |
| Project descriptions, which doubled as the speed experiment below | #15 to #19 | 5 | $2.94 | 45m |
| Account page polish | #20 to #21 | 2 | $0.80 | 13m |
| Readable audit log, with names that survive deletes | #22 to #24 | 3 | $1.92 | 31m |
| Email: password reset, verification, invitations | #26 to #28 | 5 | $4.32 | 1h 11m |
| Per-environment access control | #29 to #32 | 4 | $4.37 | 1h 46m |
| Master-key rotation | #33 | 1 | $0.90 | 22m |
| Workspace slugs in URLs | #34 to #35 | 2 | $1.82 | 45m |
| API changes for self-hosting | #36 | 1 | $0.57 | 19m |
| Cloud setup, failed starts and environment checks | None | 25 | $0.22 | 36m |
| Total | 61 | $43.70 | 16h 56m |
PRs #13, #14, #25 and #37 were small changes Claude Code made directly: two UI fixes, removing generated report files, the CI workflow, and the hosting setup.
Two things stand out. First, a feature after the MVP cost $1 to $6 and took 20 minutes to 2 hours, including its browser tests. Second, almost half of everything went into one run: the first browser-test run, at $13.02 and 3 hours 37 minutes. That run is where the Workbench improvements started.
Nineteen runs failed before their agent started, mostly on the first day, while we got the three Workbenches running in cloud sandboxes for the first time. Those failures cost nothing in model usage. The one stalled run that did cost something cost $0.11.
Improving the Workbenches while building with them
Every run leaves evidence: a transcript, a gate result, a pull request. When a run went wrong, we asked whether the Workbench let it go wrong, and fixed the package rather than the one repo. A Workbench version is immutable, so each fix became a new version, and the next run proved whether it worked. Over four days the three packages went through 34 published versions.
- e2e 0.1.31hono 0.1.26
Runs that hang silently
The first browser-test run hit a permission prompt nobody saw and sat idle for 2.5 hours. The next one stalled after Playwright finished, because the test process never exited.
The service tool gained a hard timeout. The gate gained one too, plus the ability to run named spec files. The runner allowed the sandbox paths it kept asking about. The instructions gained a run budget: iterate on single files, run the full suite once, at most twice.
Result: No browser-test run has hung since.
- e2e 0.1.32hono 0.1.27
A 45-minute test suite
The suite slept 62 seconds before every test to stay under the API's auth rate limit, and ran on one worker. The instructions already said "run in parallel". The agent had a reason not to, and nothing measured speed, so a slow suite still counted as done.
We made speed part of the gate. It fails on fixed sleeps in tests, or on an average of more than 20 seconds per test across a full run. We added a parallel Playwright config and a sign-in-once setup as templates. Raising a rate limit through the app's own config in a throwaway test environment became explicitly allowed. And when the app is what makes tests slow, the Workbench writes a handoff instead of working around it.
Result: Covered in the experiment below.
- hono 0.1.29e2e 0.1.34
Rules that were too narrow
The backend Workbench hit 429s in its own tests and added retries, because its rate-limit rule only covered "code you touch". OpenCode also cut off the full browser suite at its default 120-second command limit.
The backend rule now treats any 429 in its own tests as a sign the limit should be configurable, and bans retries and sleeps around a rate limiter. The e2e instructions now run long gate commands in the background or with a longer timeout.
- all three
Files nobody asked for
Browser-test runs committed their reports to the repo as Markdown, justified by an allowance for "test-only documentation".
All three Workbenches now create no new Markdown files unless the task names one. Reports go in the pull request and the final message.
- hono 0.1.30e2e 0.1.37
Pausing to ask for test config
Runs stopped to ask for values like a test email sender or a reset-link lifetime, which aren't secrets.
When
.envis missing, a Workbench now builds its throwaway test environment itself. Plain settings come from.env.example, and secrets are fresh random values, never printed or committed. The example mail sender is allowed only while mail goes to the sandbox's Mailpit. - svelte 0.1.29
A field with no job
Users had to pick a workspace slug, but URLs used the internal ID. We noticed by using the app; no test asked about it.
The frontend Workbench now has a rule: when users choose a readable identifier, URLs use it, and a field the user must fill has a visible job.
Result: The next run moved URLs to slugs and made building a URL from an ID a type error.
- e2e 0.1.35
A gate that was too strict
A targeted rerun of three screenshot-heavy files failed the speed check at 23.1 seconds a test, though the full suite passed at 15.9.
The average now fails only full-suite runs. Targeted runs get a warning, and still fail on sleeps.
The experiment: does a Workbench fix itself?
To test the speed changes, we built a small feature, project descriptions, without mentioning speed, sleeps or rate limits in any task. The question was whether the new gate alone would get the existing slow suite fixed.
It did. The browser-test run found the 62-second sleeps, removed them, moved to 4 workers and API sign-in once per role, and hit 429s on the older tests. As instructed, it didn't work around them. It wrote a handoff:
Handoff: application changes needed (condensed from PR #17) apps/api/src/auth.ts:85 hardcodes 100 requests per 60 seconds, and Better Auth limits sign-up and sign-in to 3 per 10 seconds. Older specs that sign up through the UI hit 429s: 13 of 29 failed in setup. Make these limits configurable, keeping production values as defaults.The Workbenches don't know about each other, by design. Each package stands alone and never names another. So the orchestrator relays a handoff like this one: it passed the text to the backend Workbench, which made six rate limits configurable without changing production behavior. Then it ran the full suite once more.
- Tests
- 35
- Workers
- 1
- Full suite
- ~45 min
- Per test
- ~75 s, mostly sleeping
- Rate limiting
- waited out
- Tests
- 52
- Workers
- 4
- Full suite
- 3 min 22 s
- Per test
- 14.7 s
- 429s
- 0 of 2,876 requests
It has held since. By the end, the suite had 82 tests and ran in 4 minutes 42 seconds. Browser-test runs that wrote new coverage cost $1.10 to $2.94 each, against $13.02 for the first one.
Under the hood
A demo can look finished while the code underneath is hard to change. So we looked at the repository the way we'd look at a contractor's: how it's laid out, what adding a feature costs, and what would slow the next person down.
| Path | What lives there | Files | Lines |
|---|---|---|---|
shared/contracts | Zod schemas and route builders, used by the API, the dashboard and the CLI | 5 | 322 |
apps/api/src | Hono routes, Better Auth, encryption, access policy, audit | 26 | 1,390 |
apps/api/integration, test | HTTP integration tests against real Postgres and Mailpit, plus unit tests | 14 | 2,213 |
apps/api/drizzle | 5 versioned migrations and their schema snapshots | 11 | 7,152 |
apps/web/src | SvelteKit static dashboard. 112 of these files are vendored shadcn-svelte components. | 232 | 6,771 |
apps/web/e2e | Playwright suite: 82 tests, its runner and sign-in setup | 53 | 3,913 |
apps/cli/src | The vault CLI | 1 | 224 |
deploy | Docker Compose, Caddy, Tailscale and the backup script | 6 | 166 |
Structure
The shape is conventional, which is a compliment. Every request and response is defined once in shared/contracts, and the API, dashboard and CLI all import it, so a renamed field fails typecheck everywhere at once. Identity, sessions and organizations come from Better Auth instead of hand-rolled code. Secrets use envelope encryption: a master keyring wraps one data key per project. The dashboard is a static build with no server of its own, so the API is the only thing that ever holds a credential.
Extensibility
Each feature landed in the same few places, so the next one is easy to predict. Project descriptions is the smallest clean example. The backend commit changed about 22 lines of application code: 4 in the schema, a 2-line migration, 8 in the projects route and 8 in the shared contract. It came with a 163-line integration test. The UI side was three form components, a two-line API client change, and four lines on the overview page. Bigger features, like per-environment access, followed the same path through contract, route, UI and browser tests, just with more of each.
In its favor
- TypeScript strict mode everywhere, and no
anycasts in the API. - The API has 7 runtime dependencies, and more test code than application code: 2,213 lines against 1,390.
- Database constraints back up the application rules. Secret versions and audit events are immutable at the database level.
- CI runs typecheck, lint, the API integration suite and all 82 browser tests on every pull request, in about 7 minutes.
- The README covers setup, every endpoint, key rotation, hosting, upgrades and restores.
What would slow the next person down
- Dense code. The API averages 63 characters a line, and 76 lines run past 160 characters, up to 325. Some dashboard lines reach 904, mostly long class strings. There's no formatter, and the API's lint is only the TypeScript compiler's unused-code checks.
- One 630-line form helper (
custom-form.svelte.ts) carries most of the dashboard's form logic. - UI copy left over from building: helper text about scrolling tables on narrow screens shows on desktop too, and every project page repeats the same tagline.
- Light theme only. The version history shows raw IDs, and
vault secretsprints raw JSON.
Most of that list can be fixed in the Workbenches, which makes it the next round of Workbench changes. A formatter config and a real linter in the backend package would end the dense lines. A "no build notes in the UI" rule in the frontend package would catch the leftover helper text. As with the speed check, a gate measures these things better than prose does.
How good is it?
Vault is running for our team on one of our own machines, reachable only over Tailscale, with real email, nightly backups and master-key rotation. Every pull request runs typecheck, lint, the API integration suite and the full browser suite in CI.
What the browser tests caught
- Keyboard focus not landing in a page's main input, or not returning after a bulk save, profile save or rename.
- The dotenv download saving as
env.txt. - Help text still saying "Vault does not send emails" after email shipped.
- Stale permissions after an owner changed a member's access. The server still refused the write with a 403, and the tests proved that too.
- A flaky invitation test, caught by CI on GitHub's machines and fixed by the run itself.
What the agents caught themselves
- Better Auth turns off its own cross-site checks in test mode, so the tests weren't exercising production protection.
- Better Auth's
*path pattern doesn't cross a/, so the first version of the new sign-up rate limit didn't apply to/sign-up/email. - Two owners removing each other at the same moment could leave a workspace ownerless. A lock now prevents it.
- A secret written during a master-key rotation could pick up a key mid-change. Rotation and secret writes now take locks so they never overlap.
What a person caught
- Two audit events for one sign-up.
- A delete button bigger than every other button in the app.
- The slug field that did nothing.
All three were judgment calls no test had been asked to make. Using the app after each merge was worth it.
The weakest result came from the orchestrator, not a Workbench. The first dashboard task told the frontend Workbench not to touch the shared contracts. Those contracts had no sign-up or workspace schemas, so the first dashboard had no way to sign up. One backend run and one frontend run, $2.13 together, filled the gap. The lesson: a Workbench follows its task's boundaries exactly, so the task has to draw them in the right place.
Still missing: two-factor login, a dark theme, an installable CLI, and choosing a project by name instead of by ID when linking a directory.
What we'd tell someone doing this
Fix the package, not the repo. When a run goes wrong, the cheapest fix is often one rule or one gate check in the Workbench. Every later run, in every repo, gets it for free.
Make the gate measure what you care about. Telling the agent to run tests in parallel didn't change anything. Failing the gate on fixed sleeps did, on the first try, without being asked.
Keep Workbenches separate and relay between them. The handoff format let the browser-test Workbench ask for an API change it isn't allowed to make. The orchestrator carried it over in one run.
Keep tasks narrow. The cheapest runs were the narrowest: three named test files and two attempts for $0.30, or a two-file fix for $0.24.
How we counted
- Costs and times come from the Workbenches runs API for the project's 61 runs, Oct 23 to 26, 2026. Run time runs from each run's start to its finish, including time spent waiting for CI or for an answer.
- Costs are model usage only. They exclude sandbox billing and the orchestrating Claude Code session.
- "Building features" means the 33 completed runs outside cloud setup and environment checks. Three more feature runs failed: one stalled browser-test run and two sandbox build failures.
- The "Before" column of the experiment is estimated from the suite's code at the time. Every other number comes from the runs API, the repository, or the Workbench registry as of Oct 26, 2026.
- Screenshots and CLI output come from a throwaway local copy with example data, not our own instance.